Comparing Republican and Democratic voters: Education, ethnicity, religion, etc.
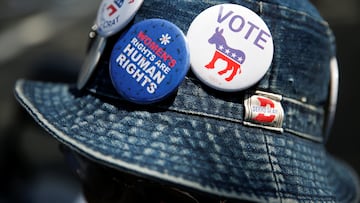
Despite some major shifts, voter partisanship in the US is virtually evenly divided among those who align themselves with the Democrats and Republicans.

A lot has changed in the United States over the past 30 years including demographic shifts helping to reshape partisan coalitions. While some long-standing patterns remain in place, there has been a dramatic shift in political affiliation among others.
However, according to an analysis of data collected by Pew Research over three decades released earlier this year, voter partisanship in the US is virtually evenly divided among those who align themselves with the Democrats or Republicans. Here’s a look at some of the findings.
Comparing Republican and Democratic voters
Currently, among registered voters 49% say they are Democrats or lean toward affiliation with the party compared to 48% who identify themselves as, or lean toward, Republicans. This hasn’t changed much as voters have been pretty much evenly split between the two major parties in the US over the past 30 years. But how does each party fare with specific groups?
Pew Research Center’s comprehensive analysis of party identification among registered voters – based on hundreds of thousands of interviews conducted over the past three decades – tracks the changes in the country and the parties since 1994. https://t.co/f2o4IsDgeZ
— Pew Research Center (@pewresearch) April 9, 2024
Education
Perhaps the biggest shift among voters’ party affiliation can be seen according to their level of academic achievement. Those without a four-year degree that say they align with the Republican party has grown dramatically. The GOP now has a six-point lead over Dems with 51% compared to 45% of registered voters who are non-college grads. This is even more evident among White voters without a college degree where more than six-in-ten say they are Republicans or lean toward the party.
Meanwhile, voters who have gotten a college degree or higher have been shifting over to the Democratic party. In the 1990s until the early 2000s, more of them felt affiliation with the Republican party. Today, 55% of registered voters with a college degree or more say they are Democrats or lean toward the party versus 42% that affiliate with or lean toward the GOP.
Contrary to the trend seen among their White counterparts, support for Democrats among Blacks with a college degree, while still overwhelming at 79%, has decreased 11 percentage points from where it was 30 years ago. Meanwhile, party preference among Black voters without a college degree hasn’t budged holding at 85%.
Ethnicity
There has been a significant change in the ethnic makeup of the American electorate since 1996. White voters have dropped from 85% to 67% of registered voters. Meanwhile Hispanics have surged from just 4% to 13% nowadays.
Registered Black voters now make up 11% today compared to 9% in 1996. And Asian voters went from 1% to 4% of the electorate over the same period.
Their growth as a percentage of the electorate has been reflected in an increased diversity within both the Democratic and Republican parties. However, the change has not been to the same degree.
Nearly three decades ago 93% of the Republican party’s voters were White. Today that amount is 79%. On the other hand, within the Democratic coalition the share of Whites has dropped from 77% to 56% during the same period.
Both parties have seen the percentage of Hispanics that affiliate with each roughly triple. However, even though the gap is narrowing, Hispanics still say they are Democrats, or lean toward the party, by a margin of almost two-to-one.
Religion
Republicans have made large gains among certain religious groups. Among White evangelical Protestants their share has increased 20 percentage points to 85% while the share that say they have allegiance to the Democrats has dropped to just 13%. Until as recently as 2009 White nonevangelical Protestants and White Catholics were more or less evenly divided between the two parties, but now strong majorities from both groups, 56% and 61% respectively, associate with the GOP.
On the other hand, Hispanic Protestants are almost evenly divided while six-in-ten Hispanic Catholics associate with the Democrats. But the latter’s share has declined by eleven percentage points in the past 15 years.
One group that has grown dramatically over the past 15 years are those who are religiously unaffiliated. While these voters have long associated with the Democrats, they do so even more nowadays with 70% identifying as Democrat or leaning toward the party.
Democrats have even stronger support among Black Protestants with more than eight-in-ten associating themselves with the party.
Other characteristics that determine party allegiance
The analysis found that more women still tend to align with Democrats while the opposite is true of men. A similar-sized gap between the two genders remained about the same between those that were married and those who were not. However, it was slightly larger for those men and women who never married.
Related stories

Nowadays, the younger the voter, the more they are likely to associate with the Dems and the older they are with the GOP. However, the wide age divides are a more recent phenomenon over the past two decades. Pew says that those differences in partisanship by age “were only very modest” in the 1990s.
As can be seen on any electoral map on election night nowadays, rural voters align with the GOP by wide margins. However, in 2008 they were evenly divided. Urban counties, whose voters generally associate with the Democrats, haven’t changed much though. Nor the suburbs which “remain about evenly divided.”
Complete your personal details to comment