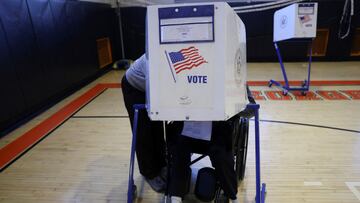
New York US Election Results 2024: who won in New York City, Albany... | Electoral map and votes by county in NY
One of the big four states in the Electoral College, New York can play the role of king-maker and we keep a beady eye on the results as they come in.


New York has been a consistent blue state since 1988, and early 2024 election results suggest that trend remains solid. With New York City holding a dense cluster of Democratic voters, it’s likely that Kamala Harris will carry the state again. Although Donald Trump’s campaign has shown a slight uptick in support compared to 2016 and 2020, he’s still expected to trail significantly. Trump lost by about 23% in both those previous elections, a margin few expect to change much.
New York City: Harris Leads with Commanding Numbers
New York City, as usual, leans heavily Democratic, a trend amplified in areas like Manhattan and Brooklyn. Votes in these boroughs strongly favor Harris, particularly in precincts with high turnout among young, urban, and minority voters. Staten Island, however, stands out as the city’s conservative stronghold, where early counts show more substantial support for Trump.
Upstate Regions Show Divided Loyalties
The upstate picture diverges from the city, reflecting a mix of urban Democrats and rural Republicans. Albany, a key Democratic enclave in the Capital Region, reports early leads for Harris. Nearby counties such as Rensselaer and Schenectady also lean blue, but Republican support strengthens in more rural areas like Montgomery and Greene.
Buffalo, as another blue stronghold, mirrors New York City’s Democratic tilt, with Harris polling well. However, surrounding counties like Erie reveal pockets of red, showing Trump’s foothold in rural parts of western New York. As votes continue to come in, Trump’s support holds strong in agricultural areas like Wyoming and Livingston counties, which play into the state’s geographic and political divides.
Suburban Battle: The Hudson Valley
In the Hudson Valley region, votes are mixed. Rockland and Putnam counties show a close race, where suburban voters remain divided. In traditionally more liberal Westchester, Harris has a solid lead, while Trump finds traction in more conservative areas of Dutchess and Orange counties. This suburban battleground could highlight shifting dynamics, with Trump’s rhetoric resonating with some voters tired of high taxes and rising living costs.
Overall State Trends: New York Remains a Democratic Stronghold
Despite some regional shifts, the state of New York remains on track to hand its electoral votes to Harris. The numbers in populous areas like New York City, Buffalo, and Albany outmatch rural Trump support. The combination of dense Democratic-leaning cities and scattered Republican rural areas underscores a long-standing political split across the state.
Here's a look at the 2020 election in New York split into its official regions #ElectionTwitter pic.twitter.com/v4V0OSXaKK
— Shaun Ketkar (@ShaunKetkar) March 20, 2021
Votes by County in New York
Here’s a breakdown of counties across New York:
- Albany
- Allegany
- Bronx
- Broome
- Cattaraugus
- Cayuga
- Chautauqua
- Chemung
- Chenango
- Clinton
- Columbia
- Cortland
- Delaware
- Dutchess
- Erie
- Essex
- Franklin
- Fulton
- Genesee
- Greene
- Hamilton
- Herkimer
- Jefferson
- Kings (Brooklyn)
- Lewis
- Livingston
- Madison
- Monroe
- Montgomery
- Nassau
- New York (Manhattan)
- Niagara
- Oneida
- Onondaga
- Ontario
- Orange
- Orleans
- Oswego
- Otsego
- Putnam
- Queens
- Rensselaer
- Richmond (Staten Island)
- Rockland
- St. Lawrence
- Saratoga
- Schenectady
- Schoharie
- Schuyler
- Seneca
- Steuben
- Suffolk
- Sullivan
- Tioga
- Tompkins
- Ulster
- Warren
- Washington
- Wayne
- Westchester
- Wyoming
- Yates
While votes are still being counted, New York’s electoral map offers no major surprises. The state’s political landscape remains deeply divided along urban-rural lines, but in a way that still leans heavily Democratic.
Related stories
With 86.9% of precincts reporting, the state is leaning heavily toward Kamala Harris. Here is what it looks like so far:
| CANDIDATE | VOTES | PERCENTAGE |
|---|---|---|
| Kamala Harris | 4,196,740 | 55.8 |
| Donald Trump | 3,326,607 | 44.2 |
*With the count an evolving thing, we will regularly update this as information becomes available.
Complete your personal details to comment