What cities in California have the hightest levels of pollution in the United States?
According to an analysis by The Guardian, California has the two cities with the worst air quality in the entire United States. Which two made the list?


According to an analysis carried out by The Guardian, California is home to the two cities with the worst air quality in the United States: Bakersfield and Los Angeles.
The reporting from The Guardian is based on the findings of a study conducted by researchers at the University of Washington, among other institutions. What they could was that air quality tended to be worse in cities and areas where racial minorities represent a larger portion of the population, particularly Black and Latino and Hispanic communities.
One of the researchers, Julian Marshall, a professor of environmental engineering at the University of Washington said described the situation as “segregation,” saying “you have segregation of people and segregation of pollution.
Bakersfield and Los Angeles, the cities with the worst air quality in the USA
Bakersfield, in Kern County, ranks first due to its “unfortunate location” in the Central Valley, as this area produces the most oil in California, and is also home to other extractive industries including oil refining, natural gas production, and mining.
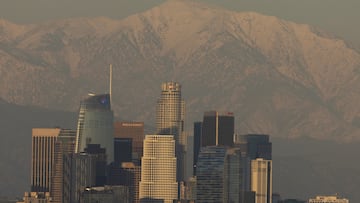
In the case of Los Angeles, segregation is more noticeable, since the air quality is bad only in the southern zone, in neighborhoods without access to the ocean, and whose periphery is highways, railway stations, and warehouses. Some of the most affected areas include Paramount, Maywood, and Compton.
On the other side of town, such as in Bel Air, where 87 percent of the population is white, the air is up to 50 percent cleaner than in the aforementioned areas.
Great report showing communities of color bear the brunt of US toxic air pollution. Bakersfield CA is worst: “They expect us to die early from this air pollution....They put everything over here to ensure that we breathe the worst air.” https://t.co/TF3LaLHA8y @Guardian
— Rocky Kistner (@therockyfiles) March 8, 2023
The 10 most polluted cities in the United States
Related stories
The analysis carried out by The Guardian covers up to the ten cities with the highest pollution in the entire United States. Then, we leave you the complete list:
- Bakersfield, California area
- South Los Angeles, California
- South and West Chicago
- Northwestern Indiana
- Downtown Indianapolis
- Houston Texas
- Saint Louis, Missouri
- Central Pennsylvania
- Downtown Atlanta, Georgia
- Downtown Birmingham, Alabama
It is worth mentioning that the data used to perform the analysis were collected between 2011 and 2015, which are the most recent figures available for the national model. However, the researchers state that contamination patterns tend to remain stable over the years, so it is highly likely that there have been no major changes in the list.

