


MLB
Baseball statistics explained: what is WHIP, OPS, ERA, OBP, SLG, etc.?
MLB stats are enough to drive an accountant insane, with numbers that mean anything, everything, and nothing, and often all three at once

Even the most cursory glance at baseball and you can see that it is a numbers paradise. Statistics are a part of all sports, but with the advent of sabermetrics, baseball has elevated them to the realm of edification, almost worship.
There was a time when the stats were seen as quaint, additional information, to help you understand trends perhaps, but the real knowledge of the game, the gut feeling if you will, was the important component.
Then the Oakland A’s, in a bid to compete in a sport where they had no money to ante-up, famously paid attention to Bill James’ writings and changed baseball forever.
Numbers were no longer objective in looking at what had happened, like ERA or batting average, but they became subjective in that they attempted to predict what was likely to happen in the future, and so were born stats like OPS+ and SLG.
There are a stunning number of statistic categories, with everything in baseball being counted and quantified, but here is a basic primer for the casual viewer.
Batting
The offensive statistics are dominated by what happens at the plate. Of course there are many more dealing with all aspects of base running, but the key ones to remember pertain to the bat.
At Bats (AB)
This one seems straightforward enough, but as with everything in baseball, there is a sting in the tail. At Bats, represented as AB in a box score, are just what it says on the tin: how many times a player has come up to the plate to bat. They could have gotten a hit, struck out, or gotten on base via an error or a fielder’s choice play. Where you can get confused as a novice is in understanding that a walk, whether it be on four balls or by being hit by the pitch, or a sacrifice play do not count as an at bat. So a player might by 0 for 0 with a walk.
Plate Appearances (PA)
This is the same as At Bats, but includes walks and sacrifice plays, taking a more literal interpretation of the name. The only time that a Plate Appearance is not recorded is if the catcher interferes with the batter. The batter will be awarded first base and neither an At Bat nor a Plate Appearance will be recorded.
Run (R) and Runs Batted In (RBI)
A run is counted when a batter rounds all the bases and touches home plate safely, it matters not whether it was through their own hitting or if they were driven in by someone else. In the latter case, a run batted in, or RBI, will be awarded to the batter who actually hit the ball to drive in the run.
Hits (H)
A hit is when the batter puts the ball into play and reaches base safely, but there is a caveat here. A batter can reach base through a defensive error, either in fielding or throwing, or through a fielder’s choice, which is when a fielder gets a baserunner out at a different base instead of the hitter at first. In either of these cases, it does not count as a hit.
There are further breakdowns of the hit statistic based on how far the batter got, whether it was a single, double, triple, or home run. These would be represented by 2B, 3B, and HR rather than simply H, indicating a single.
Base on Balls (BB)
This is another way of saying walk. Only used when a batter sees four balls during his at bat, whether an intentional walk or not. If the batter is hit by the pitch (HBP) it is counted not as a base on balls but falls into this separate category.
Strikeouts (K)
If a batter misses three pitches, it is recorded as a strikeout and written in the scorebook as the capital letter K. This indicates that the batter swung the bat and missed. If he is called out without swinging at the third strike, the capital letter ꓘ is written backwards.
Batting Statistics
Understanding how a hitter performs over time is the key to the main batting statistics. The holy grail, for more than a century, was batting average. Recent years have seen this give way to on-base percentage and slugging, but let’s take a look at what all of these mean.
Batting Average (AVG or BA)
As in any averaging exercise, you simply take the number of hits a player has so far in the season and divide them by the number of at bats. The number is expressed in thousandths so someone who gets a hit 3 out of every 10 at bats would be said to have a .300 batting average.
On-base percentage (OBP)
With the statistics for hits disallowing some of the other ways that a batter can reach base, modern teams tend to rely on a hitter’s on-base percentage as the gold standard, since it includes walks and being hit by the pitch. Seen as a more full picture of a hitter’s ability, it still discounts errors and fielder’s choice, since they have nothing to do with the batter at all.
Slugging (SLG)
Slugging is a new-ish concept (anything in baseball that is younger than 50 years is considered “new”) and takes the total number of bases that a hitter has reached (remember that doubles, triples, and home runs were counted separately) and divides that number by at-bats. The purpose of this stat is to show the power that a hitter has and rates a home run hitter over a guy who slaps singles into the outfield.
It is a somewhat controversial category because using this stat, Hall of Fame players like Rod Carew or Rickey Henderson who relied on bunts, singles and walks before doing their heavy work on the base paths, would have been seen as a liability in a batting lineup.
On-base plus slugging (OPS)
This is often considered an overall view of a hitter’s production, since it looks at how often a batter gets on base and how often they get extra bases.
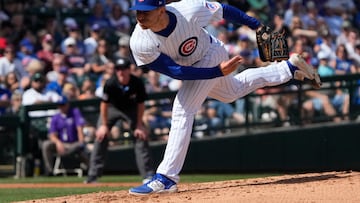
Pitching Statistics
Over on the other side of the equation, the defensive stats are pretty much dominated by pitching. Here is a basic look at the most important of them.
Innings pitched (IP)
The number of innings that a pitcher throws in a game is represented by a whole number and a decimal place. Rather than being a division of ten, however, the decimal is a division of three, with three outs making a whole inning.
Hits (H), Runs (R), and Earned Runs (ER)
The same as on the offensive side, hits and runs are charged to the pitcher that surrenders one of them. An earned run is a statistic that is exclusive to pitchers and indicates how many runs were scored as a direct result of work that the batter did, as opposed to coming off of a walk or error.
Base on balls (BB), strikes (K), and home runs (HR)
Exactly as pertains to batters, the pitcher is charged with any of these that he gives up to a hitter.
Pitch count (PC) and Strikes (ST)
This is simply an accounting exercise, but in baseball, we keep track of how many pitches that a given pitcher has thrown in an outing and how many total pitches were thrown for strikes. This is often used to give a picture of how durable a pitcher is, or conversely, how much more he may have left in the tank.
An over-reliance on these stats, pitch count in particular, has become a much-criticised feature of the game in the past decade.
Wins (W) and losses (L)
Obviously, if the pitcher’s team wins or loses the game, it should be the corresponding stat for him, right? Not so fast. A pitcher is only awarded a win if they were on the mound when their team took the lead, and they are given the loss if they were on the mound when their team surrendered the lead.
If a pitcher comes into a game with a three-run lead or less, and there is a situation where the opposing team could tie the game, and he then shuts it down, he is awarded a save (S).
Earned run average (ERA)
The yardstick by which pitchers have been measured for well over a century, the ERA is calculated by the number of earned runs they have allowed divided by the number of innings pitched and then multiplied by nine, meaning that the lower the number is, the better the pitcher has performed.
With the advent of sabermetrics, several other calculations have come into being which are argued to represent more fully the value of a pitcher to the outcome of a game.
Field Independent Pitching (FIP)
Field independent pitching is one of these calculations and it attempts to remove fielding factors, such as whether a ball was hit for a ground out to second base or a short pop fly to right field, from the pitcher’s statistics, focusing instead entirely on balls and strikes.
Purists complain that this is a wholesale misunderstanding of the game of baseball as a team sport and that a pitcher who can force lots of ground outs is worth their weight in gold.
Walks plus hits per inning pitched (WHIP)
Another attempt to give a more balanced view of a pitchers performance, and arguably more accurate than FIP, is the walks plus hits per inning pitched, which calculates the total number of baserunners allowed by a pitcher per inning. This is a more robust view of how effective a pitcher is against batters and in the end, that is what you want to know.
Admittedly, it is not a perfect stat category, but then again, none are, showing that in the end of the day, numbers can only tell you so much about what will happen when the ball is thrown over the plate.