What was the highest unemployment rate in US history?
The unemployment rate generally tracks economic cycles, and the deeper the downturn, the higher the number of people out of work. Here’s a look at the worst

Unemployment generally tracks economic cycles, when the economy is growing the unemployment rate drops and when there is a downturn it rises. However, the number of people being hired or laid off typically lags behind the actual economic health of the nation.
As more people lose their jobs, they have less money to spend and so companies sell less, forcing them to fire more people. Likewise, at the other end, when the economy begins to recover companies will hesitate to hire new employees until they are confident that things are truly improving.
In recent years, the US economy has seen two major recessions, both of which drove the unemployment rate into the double digits which hadn’t happened since 1982. However, those recessions pale in comparison to the Great Depression.
What was the highest unemployment rate in US history?
The Bureau of Labor Statistics began its first monthly studies of employment and payrolls, known as the Current Employment Statistics program, in 1915. However, it wouldn’t be until 1940 that the agency would settle on a method that made measuring unemployment on an ongoing basis possible. In March 1940 the BLS published its first Monthly Report of Unemployment, now called the Current Population Survey (CPS).
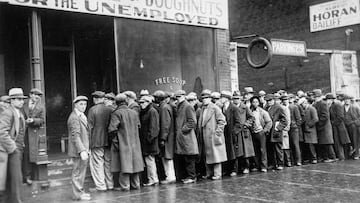
The need to do so became particularly important during the Great Depression of the 1930s when unemployment was extremely pervasive. It is estimated that the unemployment rate peaked at around 25 percent in 1933. That same year President Franklin Delano Roosevelt’s New Deal was enacted and the economy began to grow again.
However, the unemployment rate would remain in the double digits through 1940. But by the end of 1944 unemployment dropped to 1.2 percent, the lowest ever measured in US history.
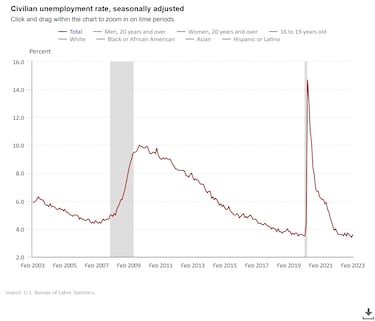
For comparison, the official unemployment rate during the covid-19 pandemic recession hit 14.7 percent. But due to the complex nature of that recession had some workers been classified differently it would’ve been 19.5 percent. The 2008 Great Recession saw the unemployment rate rise to ten percent by the October of 2009. The 1982 recession topped out at 10.8 percent.
The unemployment rate leaves out some jobless people
Related stories


One thing to keep in mind though, is that the unemployment rate does not capture all of the people that are out of work. While it is a valuable tool to help guide economic policy some people are left out.
The unemployment rate measures the number of people without a job that are seeking work. Which means that if someone that doesn’t have a job and is not looking for one, they are not counted. So the real number of people unemployed can be much higher. This helps explain why the US can report spectacular job growth and the unemployment rate increases at the same time since people that had given up looking for a job reenter the labor market. That means that the opposite is true as well.